For each of the following problems:
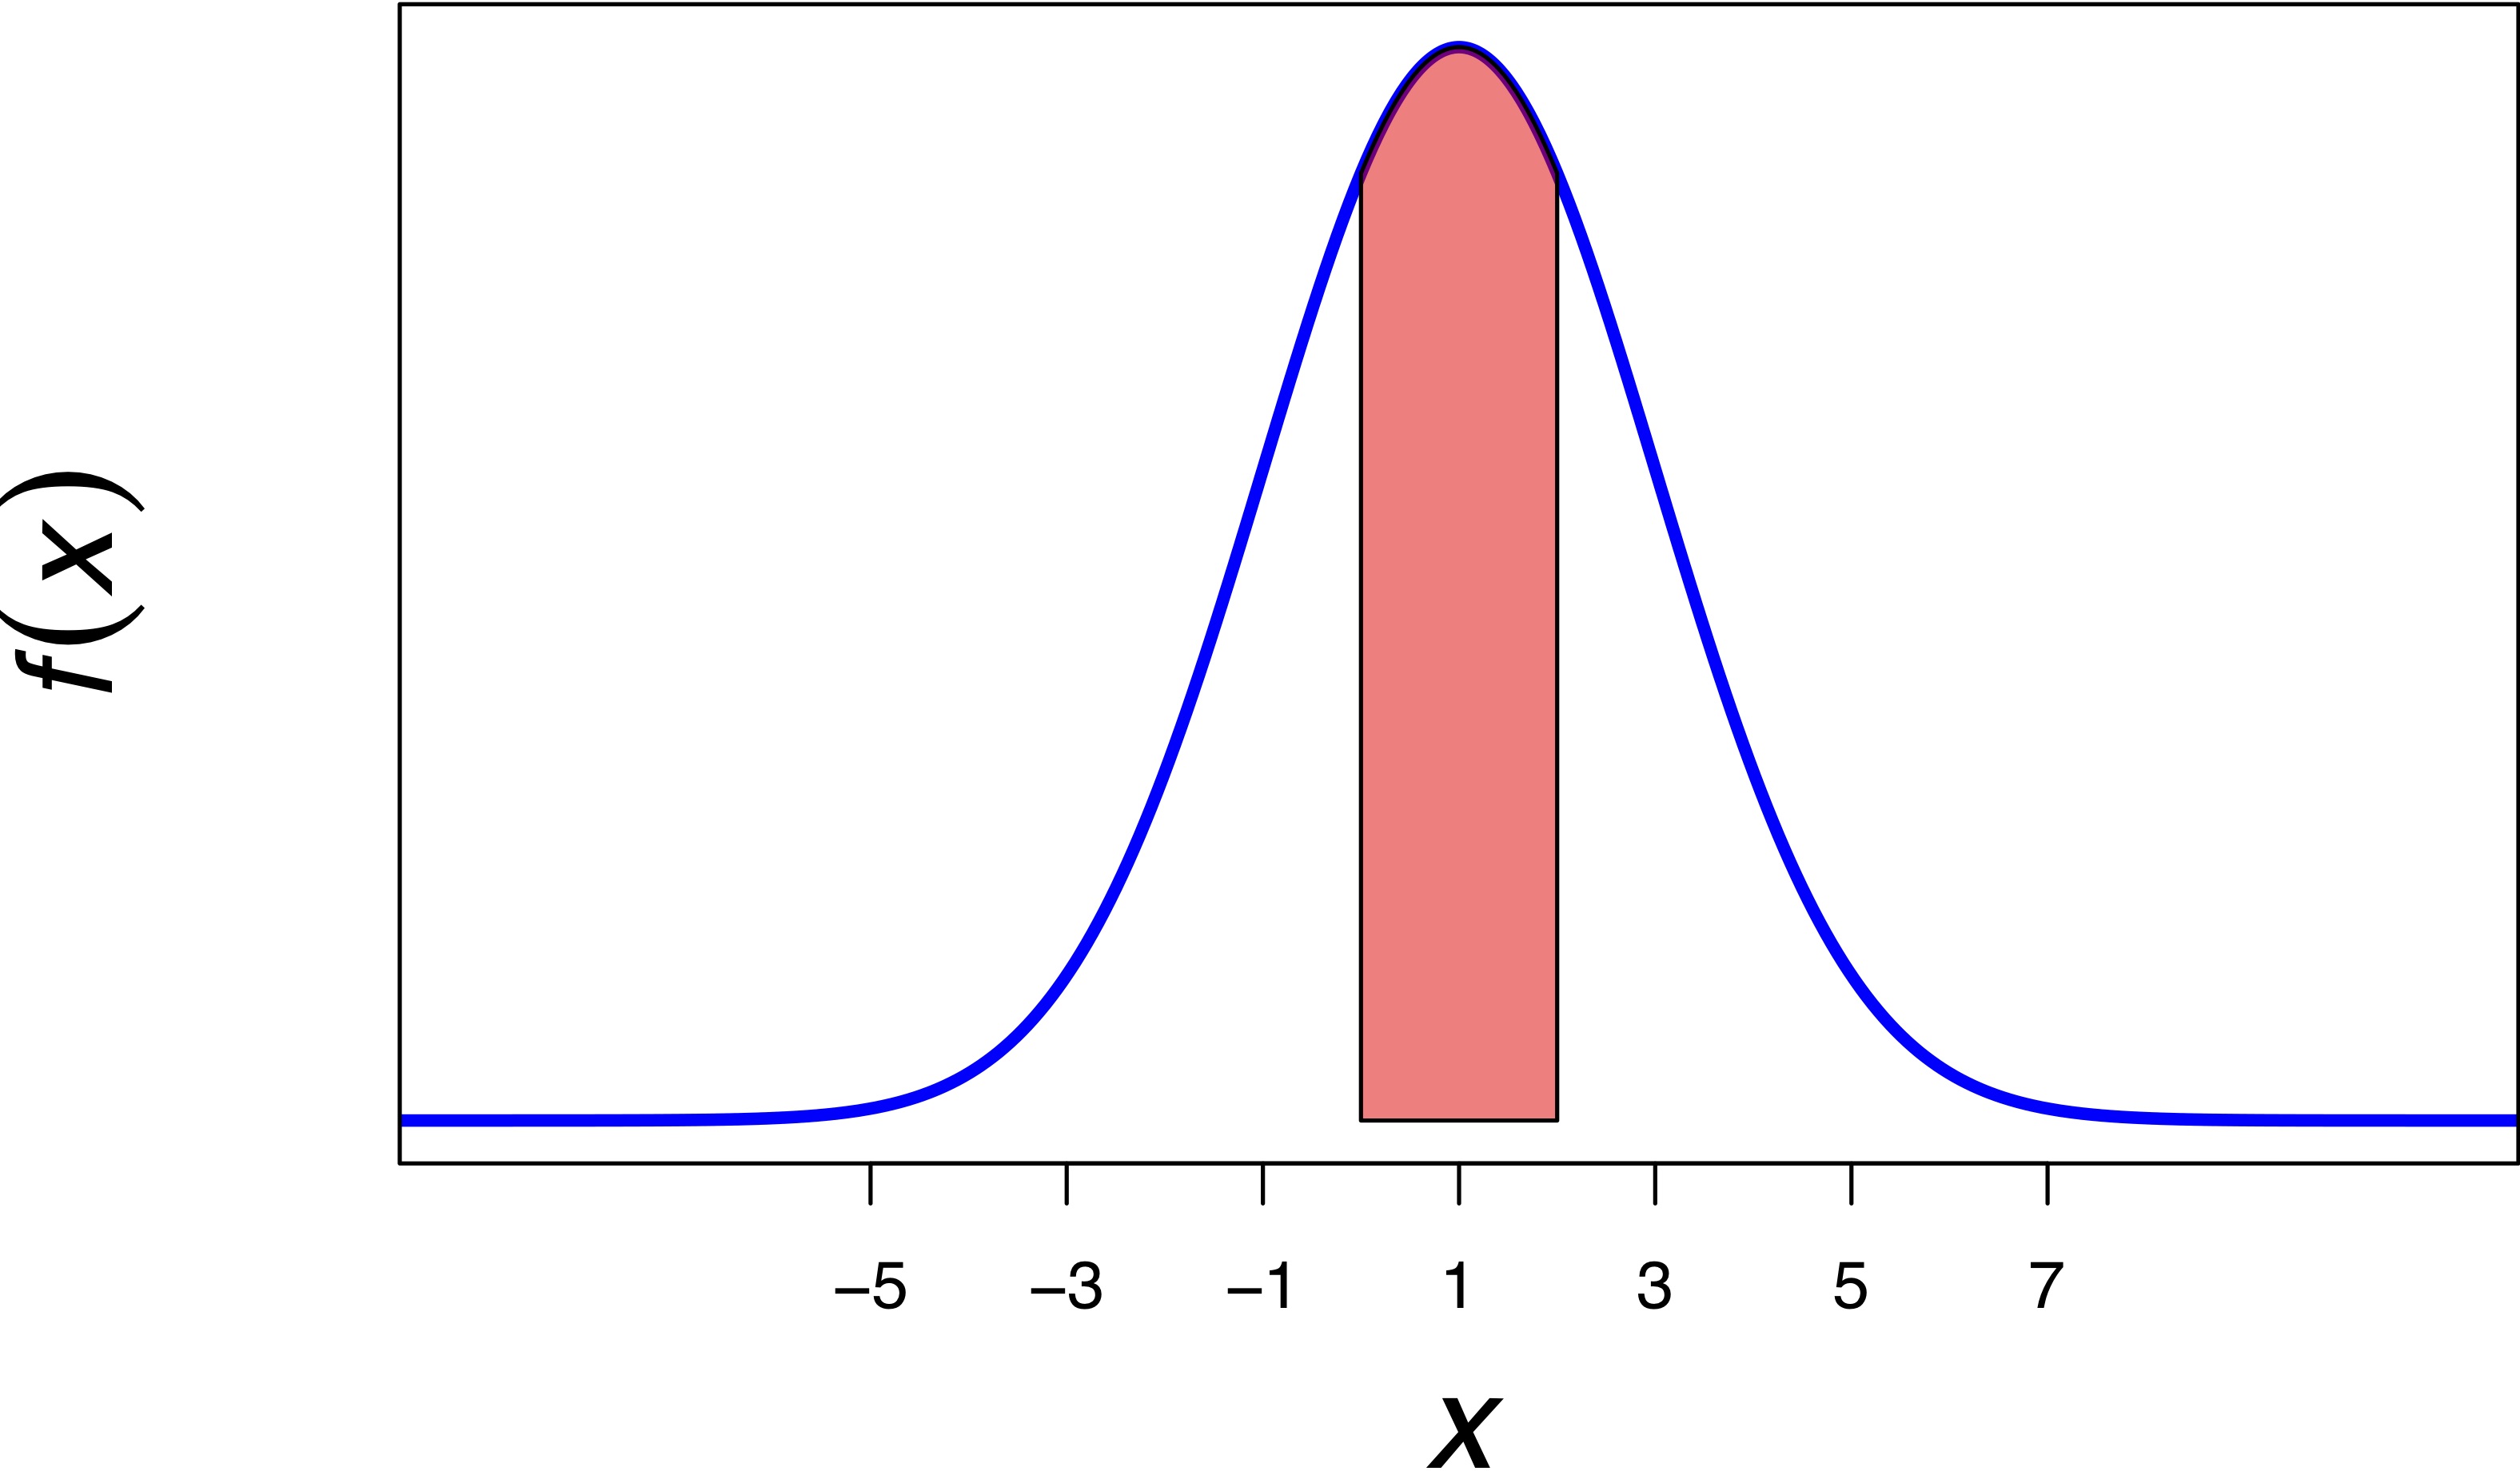
Example: If \(X \sim N(1, 2^{2})\), and you are asked to compute \(P(0 \leq X \leq 2)\), you should sketch:
as well as state and find \[ \begin{aligned} P(0 \leq X \leq 2) &= P(X \leq 2) - P(X \leq 0) \\ &= \texttt{pnorm(2, mean = 1, sd = 2) - pnorm(0, mean = 1, sd = 2)} \end{aligned} \]
Notice: I have marked the horizontal axis with \(\mu \pm k \sigma\) for \(k = 0, 1, 2, 3\).
Hint: You may find this Shiny demo useful as you get familiar with the Gaussian curve and using R to compute Gaussian probabilities. This Shiny app will generate practice problems you can work through and then check your work.
Read pages 178-180 (up to but not including "Nonstandard Normal Distributions") and page 183 (up to but not including "The Normal Distribution and Discrete Populations") in Devore & Berk about percentiles of the Gaussian (normal) distribution, and solve the following problems.