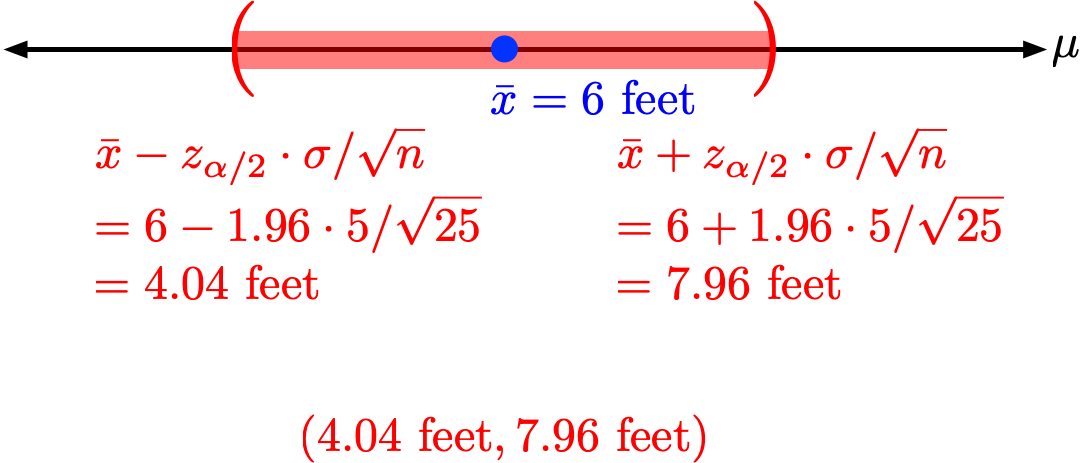
General Instructions: For all confidence intervals you compute in these problems, draw a sketch of the confidence interval on the appropriate scale. For example, if you are told that a random sample of 25 individuals from a population whose height has standard deviation \(\sigma = 1 \text{ feet}\) has (sample) mean 6 feet, and are asked to compute a 95% confidence interval for the mean height in the population, then you should also sketch (you do not need the color-coding):

Note: For all confidence intervals in this section, you should assume that the population is Gaussian (normal) and the population standard deviation \(\sigma\) is known.
Note: For all confidence intervals in this section, you should assume that the population is Gaussian (normal) and the population standard deviation \(\sigma\) is unknown.