For each of the following problems, sketch the probability density function of the normal random variable (i.e. get the general shape and placement of the probability density function correct), and indicate the area under the curve that you are computing to answer the given probability query.
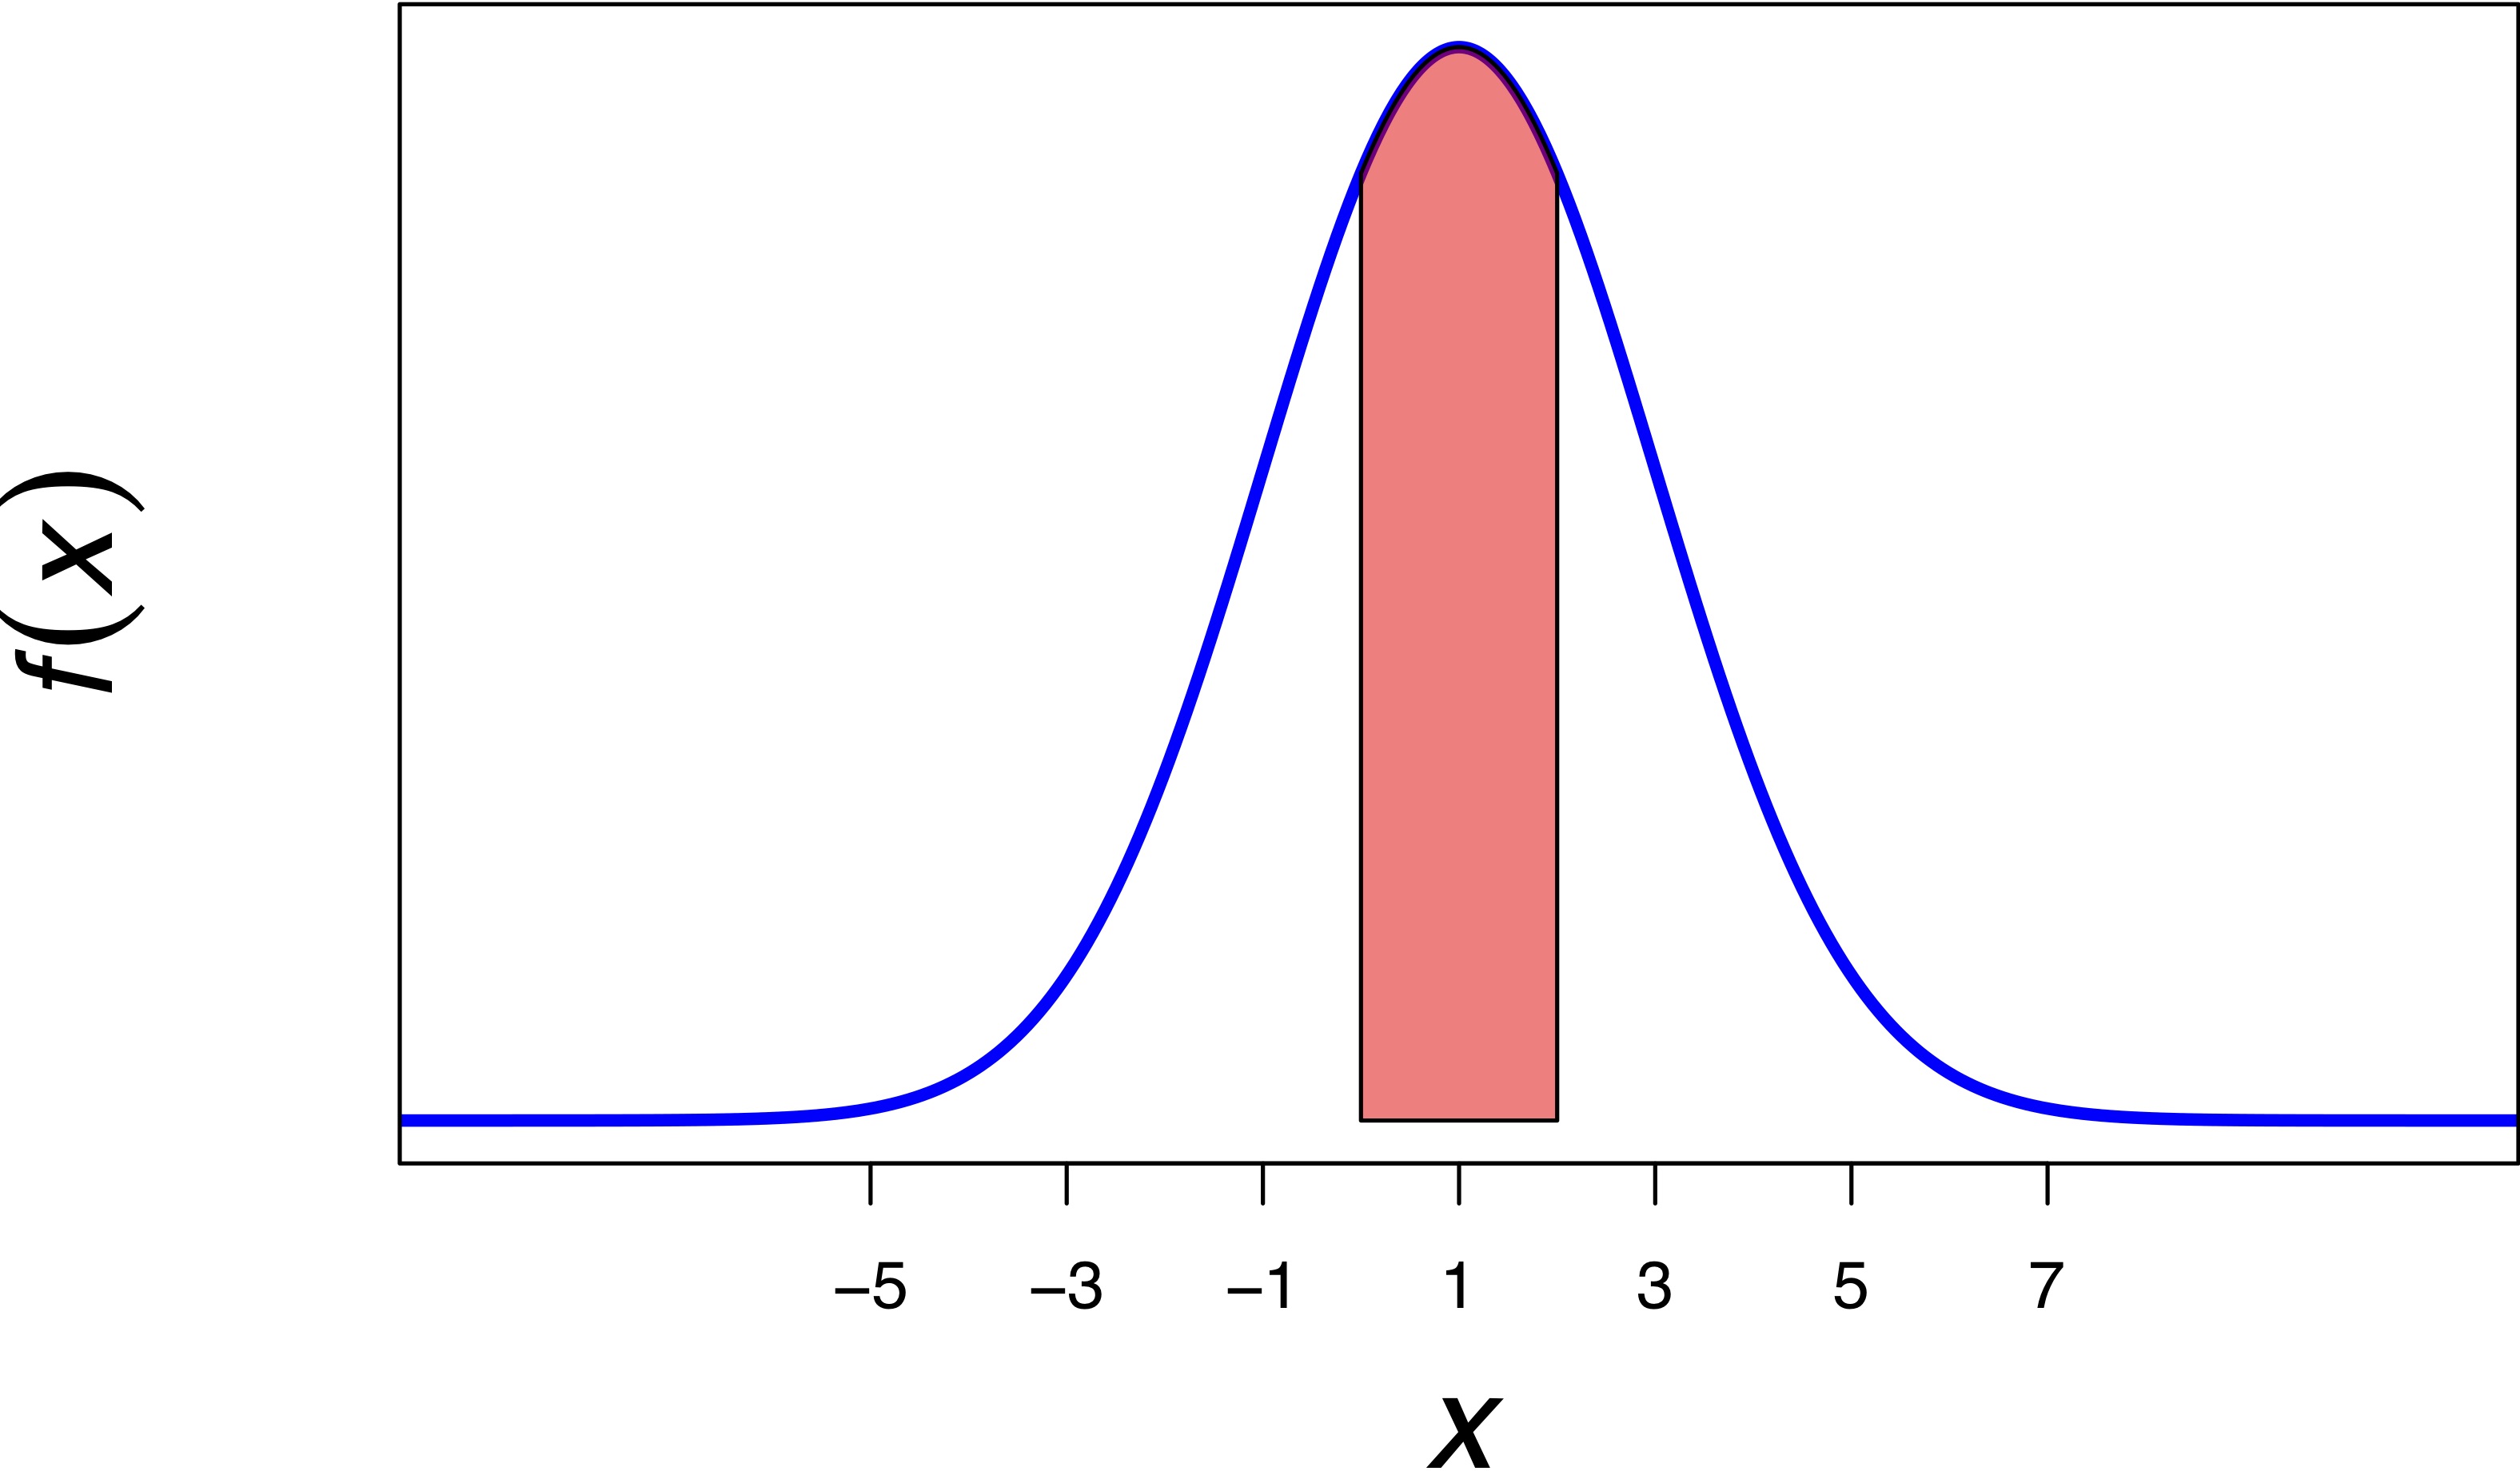
Example: If \(X \sim N(1, 2^{2})\), and you are asked to compute \(P(0 \leq X \leq 2)\), you should sketch:
as well as find the probability that \(X\) falls in \((0, 2)\).
Notice: I have marked the horizontal axis with \(\mu \pm k \sigma\) for \(k = 0, 1, 2, 3\).
Hint: You may find this Shiny demo useful as you get familiar with the Gaussian curve and reading the table of Gaussian probabilities.
Read pages 178-180 (up to "Nonstandard Normal Distributions") and page 183 (up to "The Normal Distribution and Discrete Populations") in Devore & Berk about percentiles of the Gaussian (normal) distribution, and solve the following problems.
Note: If after reading the assigned sections from the book you are still unclear about finding percentiles for a normal distribution, see this video from Khan Academy. If, after watching and thinking about this video, you are still unclear, please plan to see me during office hours.
You can use either R or Table A.3 in Devore & Berk for these problems. In either case, show all of your work.
Hint: The R function qnorm will compute quantiles (a \(100p\%\) percentile is the same as a \(p\) quantile) for you. See the qnorm section on this page for a quick tutorial.